The Distribution Company's Guide to Outbound Freight
Managing high-volume outbound LTL operations. Carrier selection by lane, batching strategies, routing guides, and the KPIs that matter for distribution businesses.
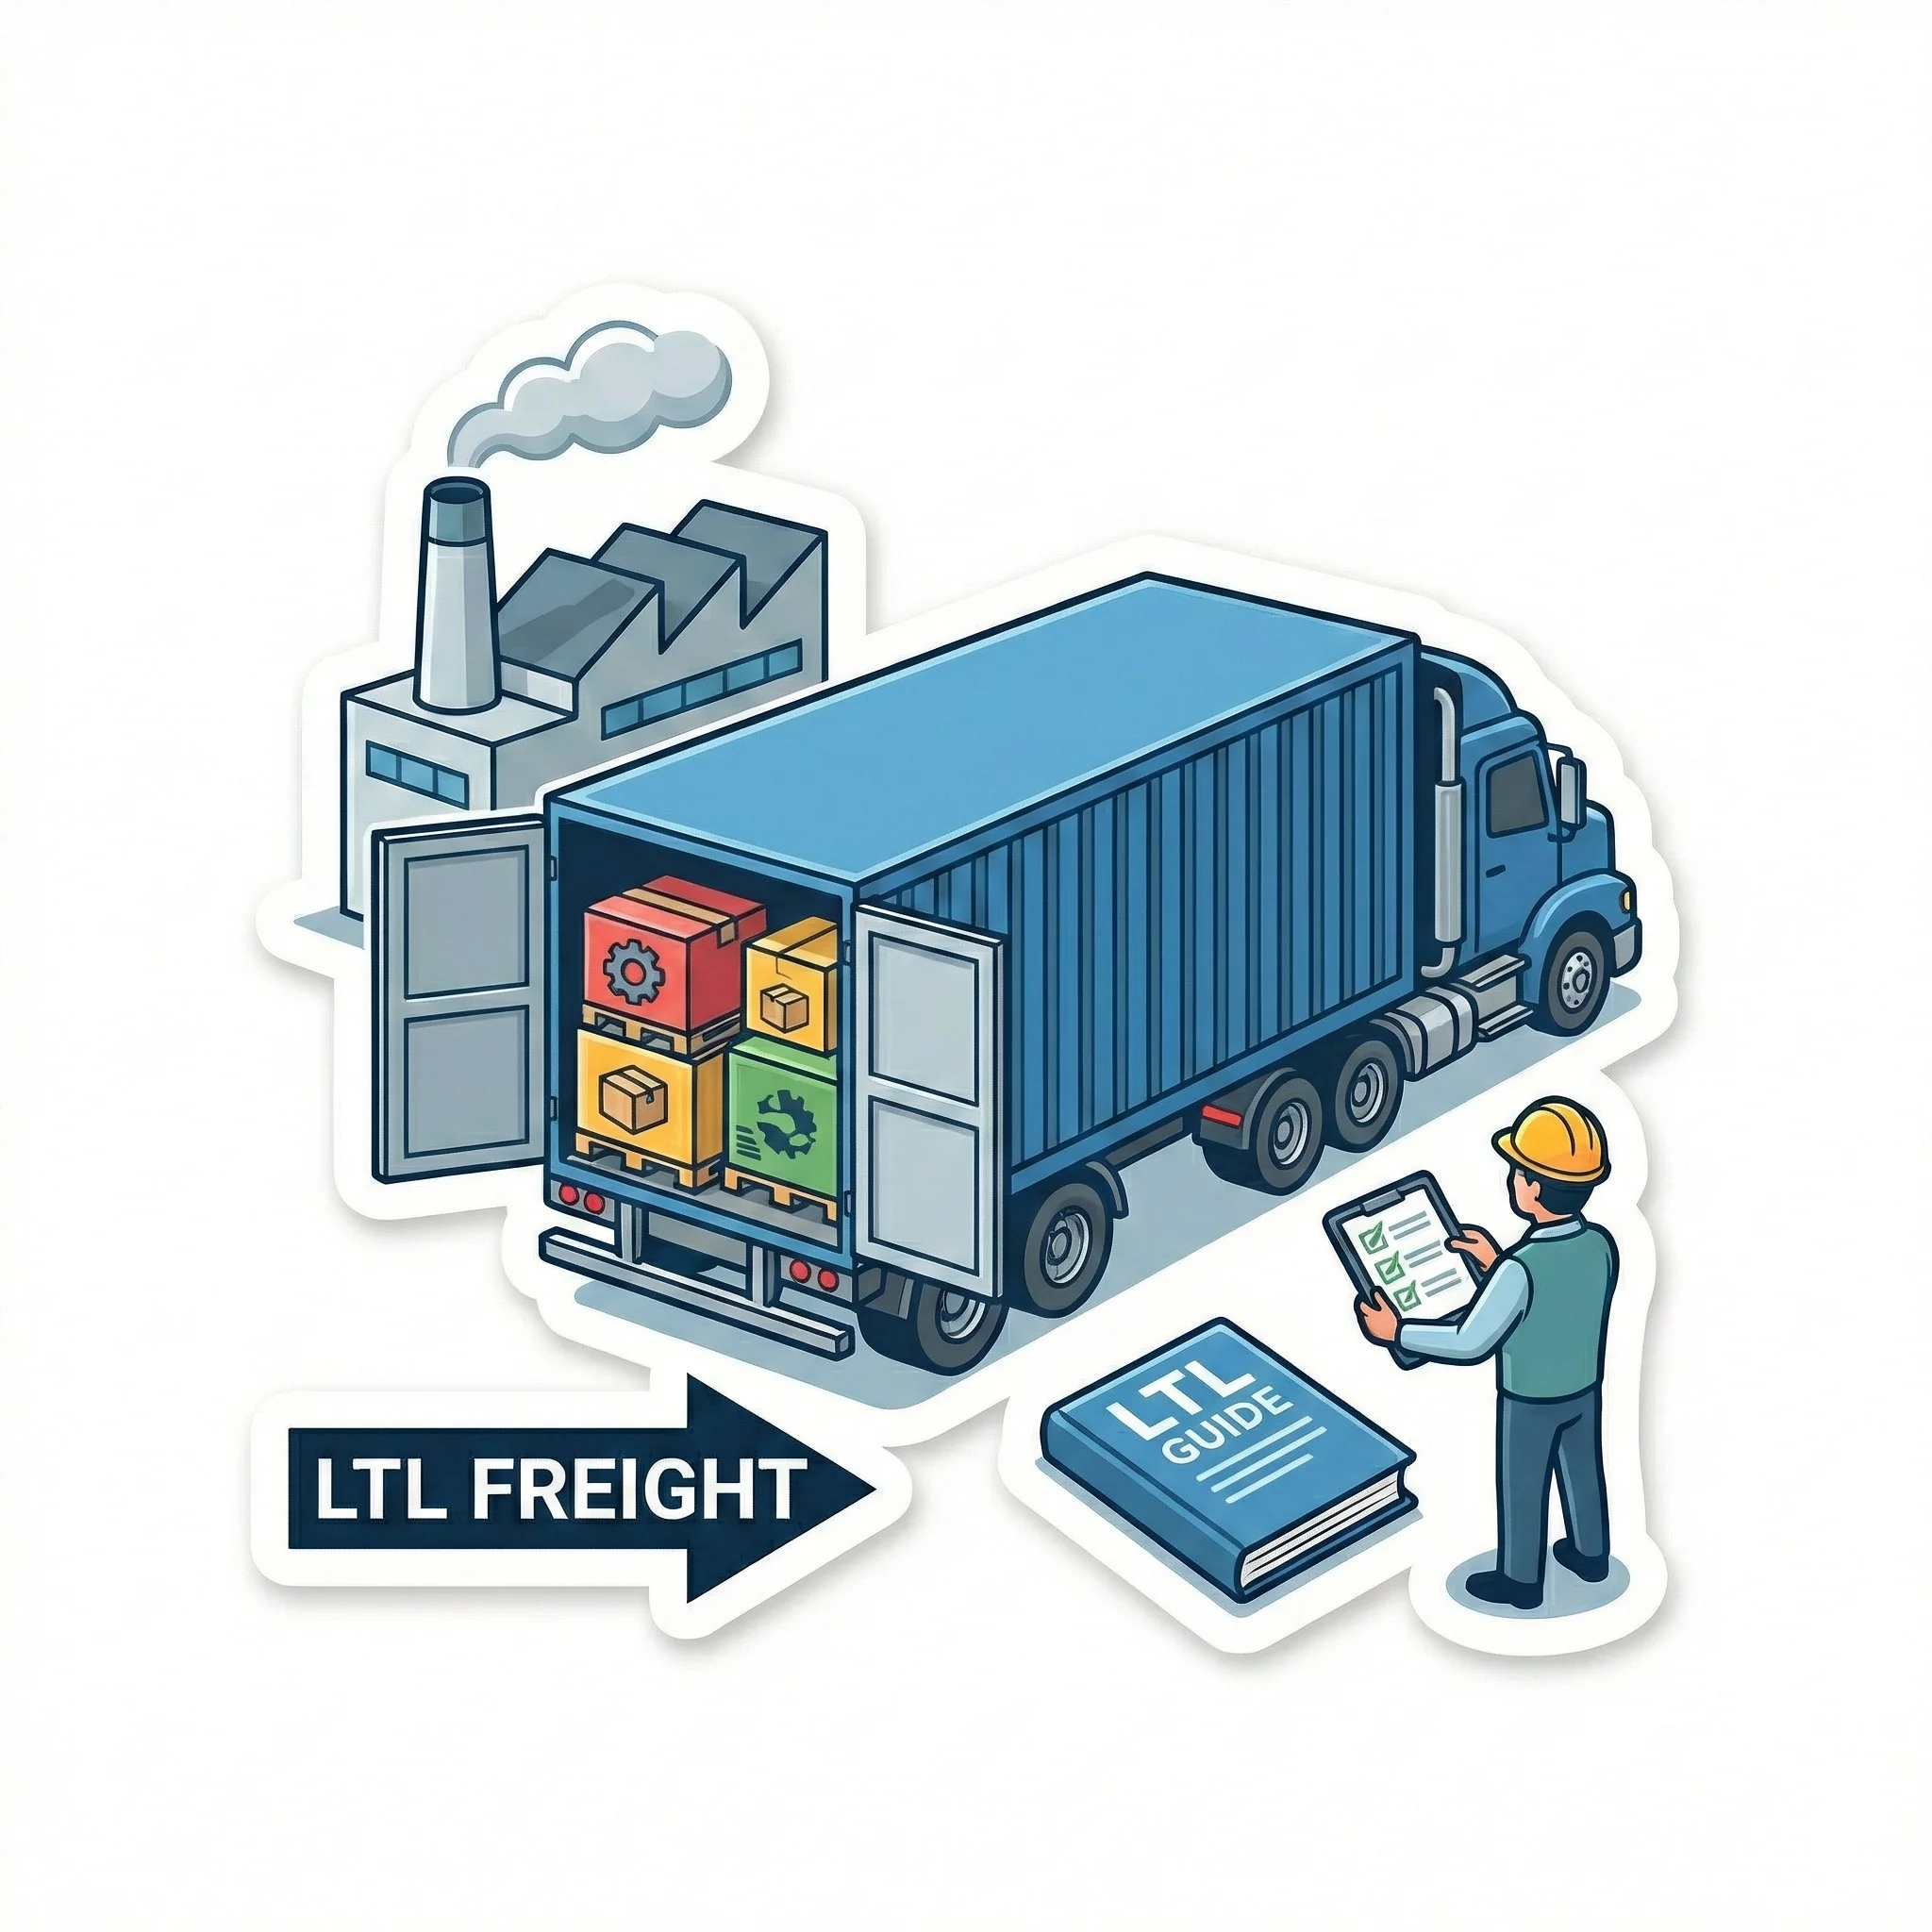
Distribution companies live and die by their outbound freight. When you’re shipping 50, 100, or 200+ LTL loads per month to customers across the country, the difference between a well-run and poorly-run shipping operation shows up directly on the bottom line.
This guide is for distribution businesses that have outgrown their basic shipping process and need to professionalize their outbound freight management.
The distribution shipping challenge
Distribution is different from manufacturing. You’re not shipping the same product to the same few customers. You’re shipping a wide variety of products to dozens or hundreds of destinations, often with tight delivery windows and demanding customers.
The operational challenges:
- Volume: 20-200+ shipments per week requires systems, not manual processes
- Diversity: Different products, weights, classes, and destinations on every shipment
- Speed: Customers expect fast turnaround from order to delivery
- Accuracy: Wrong item, wrong address, wrong carrier. Any error costs money and goodwill
- Cost pressure: Shipping is one of your largest expenses and your customers compare you to competitors
Carrier selection by lane
The biggest mistake distribution companies make is using the same carrier for everything. No single carrier is the best option across all your lanes.
Building a carrier matrix
Create a matrix of your top 10-15 destination lanes (by volume) and evaluate 3-5 carriers on each lane:
| Lane | Primary carrier | Rate | Transit | On-time % | Backup carrier |
|---|---|---|---|---|---|
| Dallas to Houston | Carrier A | $285 | 1 day | 97% | Carrier C |
| Dallas to Atlanta | Carrier B | $420 | 2 days | 95% | Carrier A |
| Dallas to Chicago | Carrier C | $510 | 3 days | 94% | Carrier B |
| Dallas to LA | Carrier A | $680 | 4 days | 92% | Carrier D |
Review this matrix quarterly. Carrier performance shifts over time as they adjust routes, pricing, and capacity.
When to deviate from the matrix
Your carrier matrix is a starting point, not a rigid rule. Deviate when:
- The primary carrier can’t pick up today (capacity constraint)
- A special shipment has unusual requirements (oversized, high value)
- A customer has a carrier preference or restriction
- Pricing is significantly out of line on a specific day
Having a platform that shows real-time rates from multiple carriers makes deviation easy and data-driven.
Batching and consolidation
Batch by region
If you have multiple orders going to the same geographic area, batch them:
Same-destination batching. Two orders to the same customer or nearby customers can often go on the same pallet or the same carrier pickup, reducing per-order shipping cost.
Regional consolidation. Five separate shipments to the Dallas metro area might consolidate into one or two shipments to a regional distribution point, then get local delivery.
Batch by carrier
If you’re shipping 15 loads today and 5 are going with Carrier A, schedule all 5 for the same pickup window. One truck visit instead of five. This reduces dock congestion and builds carrier volume for better rates.
Cutoff times
Establish firm daily cutoff times:
- Order cutoff: Orders received by 11:00 AM ship same day
- Quote cutoff: All shipments quoted and booked by 1:00 PM
- Dock cutoff: All freight staged and ready by 2:00 PM
- Pickup window: 2:00-5:00 PM
Cutoff times prevent the late-afternoon scramble and ensure consistent service.
Routing guides
A routing guide documents your standard shipping procedures for common scenarios. It’s the reference your team uses when they need to know “how do we ship this?”
What to include
Standard lanes: Primary and backup carriers, expected rates, transit times.
Special handling: Which products need liftgate, residential delivery, inside delivery, or appointment scheduling.
Customer-specific requirements: Delivery windows, reference number formats, special labeling, ASN (advance ship notice) requirements.
Carrier rules: Maximum weight per pallet for each carrier, dimensional limits, pickup scheduling procedures.
Keep it updated
A routing guide that’s six months out of date is worse than no routing guide. Assign someone to update it monthly with rate changes, carrier performance updates, and new customer requirements.
Returns and reverse logistics
Outbound freight gets all the attention, but returns processing impacts your bottom line too.
Return authorization. Establish a clear process: customer requests return, you issue an RMA number, provide shipping instructions, and specify the carrier.
Control the return shipment. Whenever possible, book the return carrier yourself rather than letting the customer choose. This gives you rate control and visibility.
Inspect returns promptly. Process returns within 48 hours of arrival. The longer returns sit uninspected, the harder it is to file carrier claims for transit damage.
Shipping KPIs for distribution
Track these metrics monthly:
Cost metrics
- Cost per pound shipped. Your overall freight efficiency metric. Track over time and compare to industry benchmarks ($0.15-$0.30/lb for typical LTL).
- Cost per shipment. Average all-in cost including accessorials.
- Freight cost as % of revenue. Your shipping expense ratio. For most distributors, 5-10% is healthy.
Service metrics
- On-time delivery rate. Percentage of shipments delivered within the quoted transit time. Target: 95%+.
- Claims ratio. Claims filed as a percentage of shipments. Target: under 1%.
- Average transit time by lane. Track whether carriers are meeting their published times.
Operational metrics
- Orders shipped per labor hour. Dock team productivity.
- Pickup compliance. Percentage of shipments picked up on the scheduled date.
- Invoice accuracy. Percentage of carrier invoices matching quoted rates.
Review these monthly with your team. Celebrate improvements and investigate deterioration.
How FreightSimple helps distribution companies
FreightSimple gives distribution companies instant multi-carrier rate comparison, automated booking, and centralized tracking for high-volume outbound operations. Compare carriers per lane, book in minutes, and track all shipments from one dashboard.
Scale your outbound shipping with the right carrier for every load.
Frequently Asked Questions
How should a distribution company choose carriers for different lanes?
Evaluate carriers by lane, not overall. A carrier that excels on your East Coast routes may be overpriced or slow to the West Coast. Track on-time performance, damage rates, and pricing by lane. Assign primary and backup carriers for each major lane based on this data. Review assignments quarterly.
What shipping KPIs should a distribution company track?
Track cost per pound shipped, on-time delivery percentage, claims ratio (claims filed vs. shipments delivered), average transit time by lane, invoice accuracy rate, and cost per shipment. Compare these metrics across carriers and over time to identify trends and improvement opportunities.